

One version of the business, updated live.
Dashboards & Reporting
When reports are assembled by hand, the business is always looking backwards. We connect the source data and show the few numbers that need attention now.
This is one of the things a Custom Software build can include, so it is scoped and priced there rather than on its own. See Custom Software and what it costs
What it looks like
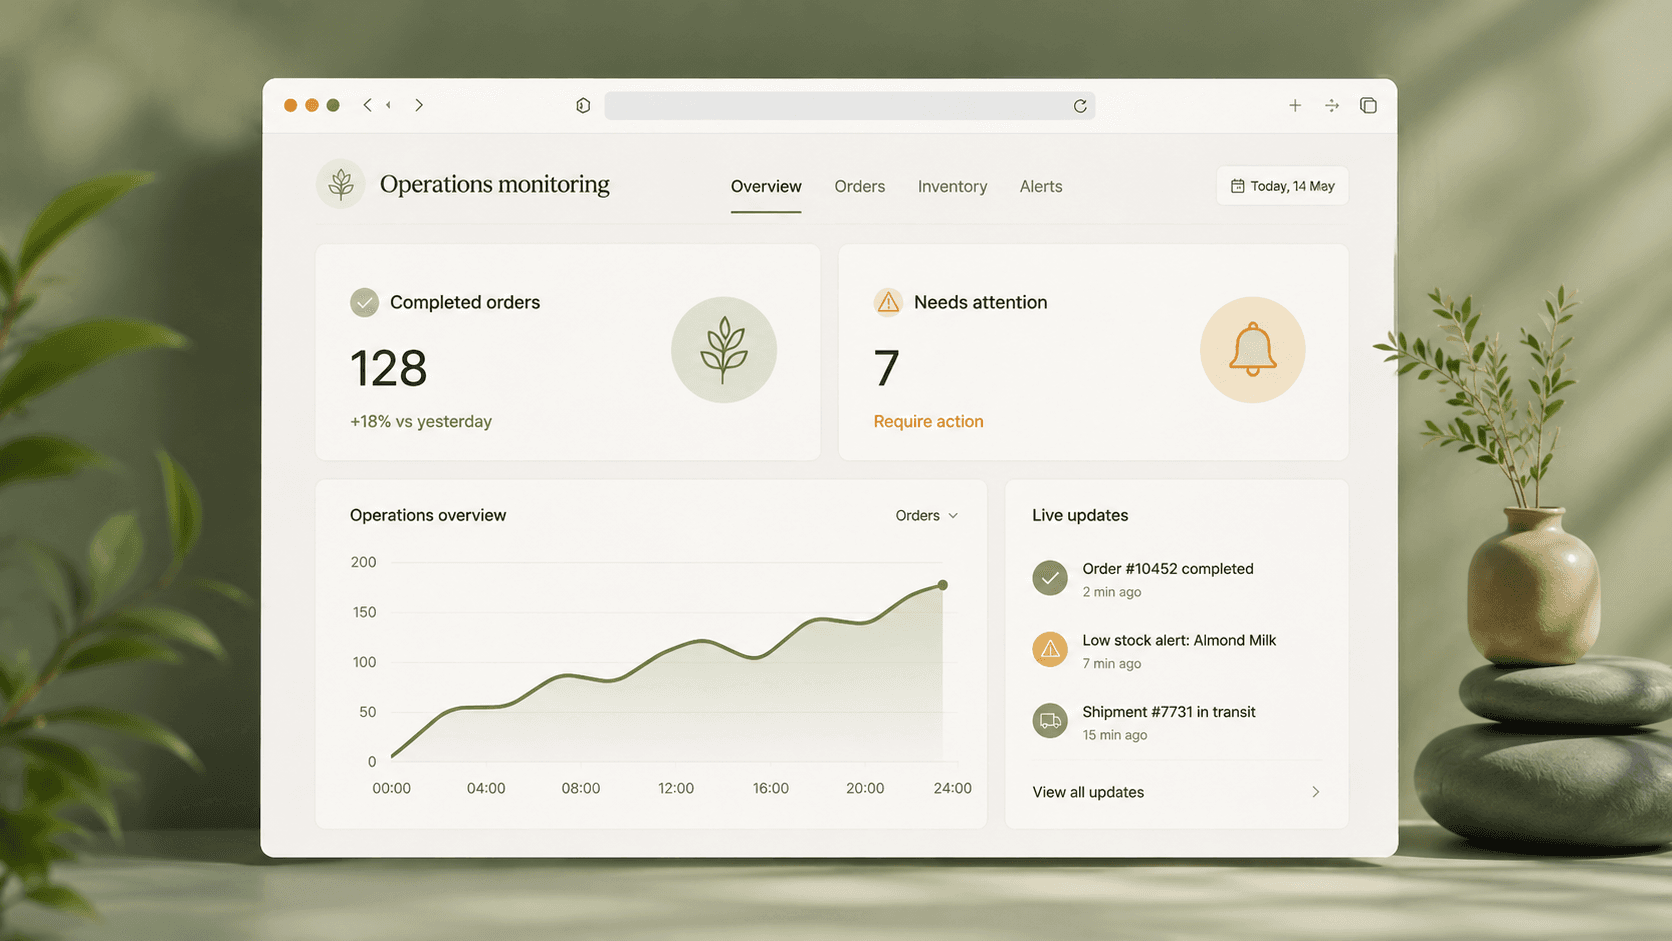
How many times a day does someone ask how many orders are still open?
Where things get stuck
- One person holds the answer. How many are open, which is oldest, what slipped: only one person can say, and every question interrupts them
- Numbers arrive tomorrow. Today's sales show up in a report someone builds tomorrow morning
- Two people, two totals. Two people quote two different numbers for the same thing, and the meeting is spent arguing which
What gets built
- One screen, live. Open orders, what needs attention and today's totals, on the phone, updated as the work happens
- Alerts find the right person. When something slips, the system tells whoever owns it, before anyone has to ask
- Every total opens. Tap a number and see the orders behind it, so nobody argues about where it came from
What you get back
- Questions stop interrupting. The answer is on the phone, so nobody has to walk over for it
- Decisions happen today. Nothing waits for Monday's report
- One version of the business. Everyone reads the same number and spends the meeting on what to do about it
Ideal for
Teams with enough data flowing through their systems to make a dashboard meaningful, typically businesses past RM 200k monthly revenue, or operational teams handling 100+ transactions a day.
Might not be the right fit
Pre-revenue startups or businesses that have not structured their underlying data yet. We will say so on the discovery call and recommend fixing the data layer first.
Nobody is asking for a dashboard. They are asking how many are open and which one is oldest. When only one person can answer that, every answer is an interruption, and the interruptions are invisible until you count them.
How a dashboard build goes
01
Define
We sit with the people who run on these numbers. We agree on the 5 to 10 metrics that matter and how each one is calculated.
02
Plumb
We connect to the source systems and stage the data. Performance and refresh frequency designed for your data shape.
03
Build
The first dashboard usually ships in 3 to 5 weeks using real production data.
04
Iterate
After two weeks of use we refine, most teams realise they want a different cut once they see the first one.
FAQ
FAQ
No. We build on what you already run and already pay for, unless there is a real reason to move.
Then that is the first job, and we will say so rather than build a dashboard on numbers you cannot trust. A confident chart over bad data is worse than no chart.
No. We size it for the volume you will have in three years, not the volume you have this month.
Which of these sounds like your business?
Same work, different companies. Open the one you recognise and see what it takes to remove it.
System Integration
Enter it once. Use it everywhere.
Sign you'd want this
The same number lives in three places and nobody is sure which one is right
Process Automation
The routine work should run without chasing.
Sign you'd want this
Approvals wait for someone to notice a WhatsApp message
Practical AI
Give AI one useful job.
Sign you'd want this
Your staff spend hours reading documents just to pull out a few numbers
Which part of this is your problem?
Two or three sentences is enough. We will tell you what the first useful phase looks like before you commit to a build.